¶ Overview – AMR System Dashboard
The Overview page provides a centralized summary of the overall AMR system status, meter health, site connectivity, consumption, and building information.
It provides users with a quick view of system performance across Abu Dhabi, Dubai, and Sharjah, along with building-level information, meter status, consumption trends, weather conditions, and critical error information.
The Overview page includes:
- Emirate-wise site and meter counts
- Overall system summary
- Connected and disconnected site status
- Building and site map
- Meter health status
- Last 30 days consumption
- Consumption trends
- Weather information
- Critical error types
Info: The Overview page provides a consolidated view of AMR system performance and helps users quickly identify sites, meters, consumption information, and issues that may require attention.
¶ Emirate-wise Summary Cards
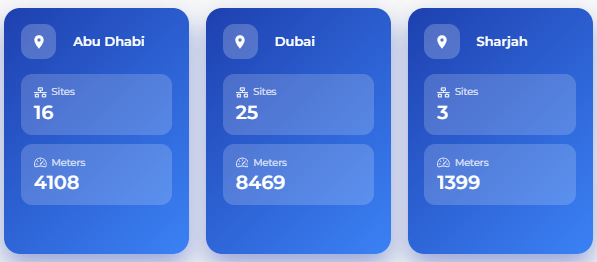
The Emirate Summary Cards provide a breakdown of the total sites and meters available in each Emirate.
The cards display information for:
- Abu Dhabi
- Dubai
- Sharjah
Each card provides:
| Information | Description |
|---|---|
| Sites | Total number of sites/buildings associated with the Emirate. |
| Meters | Total number of meters associated with the Emirate. |
This provides users with a quick comparison of site and meter distribution across the different Emirates.
¶ Overall System Summary

The Overall System Summary card provides the overall system totals across all locations.
It includes:
| Information | Description |
|---|---|
| Emirates | Total number of Emirates represented in the system. |
| Buildings | Total number of buildings/sites across the system. |
| Meters | Total number of meters across all buildings. |
This card provides a high-level view of the overall AMR system size.
¶ Site Connectivity Status

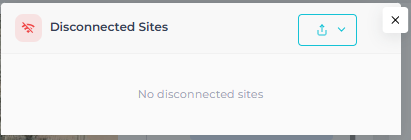
The Site Connectivity Status cards provide a quick view of the connectivity status of sites.
The cards display:
- Connected Sites
- Disconnected Sites
The connectivity status is determined based on Router connectivity.
¶ Disconnected Sites
Selecting the Disconnected Sites card opens a detailed list of sites that are currently disconnected.
This allows users to identify sites that may require connectivity or communication-related investigation.
Warning: Disconnected sites may require further investigation of their Router or communication status.
¶ Last 30 Days Consumption

The Last 30 Days Consumption card displays the total consumption of the selected building for a rolling 30-day period.
The consumption is displayed in:
- RTh
- kWh
The period covers the previous 30 days from the current date and time.
This provides users with a quick overview of recent consumption for the selected building.
¶ This Month Consumption Trends
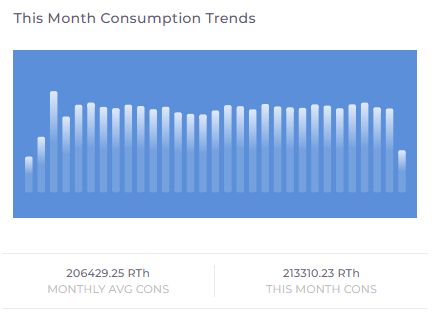
The This Month Consumption Trends section displays the daily consumption trend for the selected building over the previous 30 days.
The section provides:
- Daily consumption
- Average consumption
- Total consumption for the 30-day period
The consumption trend is measured in RTh.
This allows users to review recent consumption behavior and identify changes or unusual patterns over the selected period.
¶ Health Status
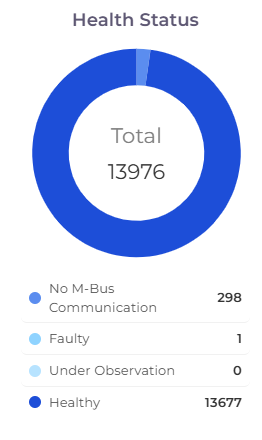
The Health Status card provides an overview of the current health condition of meters.
Meters are categorized into:
- Healthy
- No M-Bus Communication
- Faulty
- Under Observation
This provides users with a quick view of the overall meter health and helps identify categories that may require attention.
Info: The Health Status card provides a high-level summary of meter conditions across the system.
¶ Map
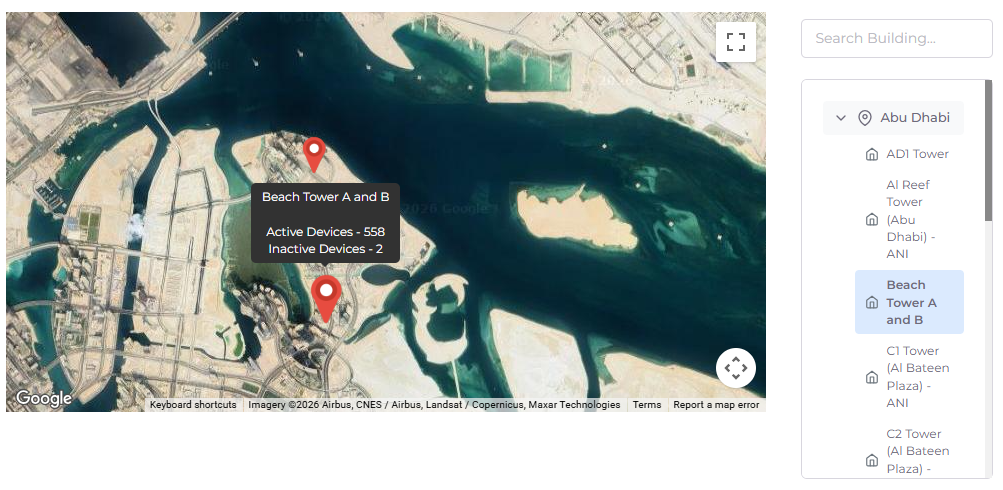
The Map section provides a geographical view of the selected building and its device status.
The map displays the selected building along with its:
- Active device count
- Inactive device count
¶ Building List
The building list allows users to:
- Search for a building.
- Select a building.
- View the selected building on the map.
An orange indicator on the building icon highlights buildings that are currently offline.
¶ Facility Overview
Selecting a building icon redirects the user to the Facility Overview page.
The Facility Overview page displays detailed information about the selected building.
Info: The map provides a quick way to locate buildings and identify buildings that are currently offline.
¶ Weather
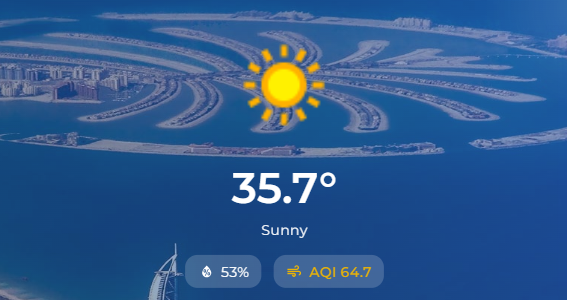
The Weather card displays the current weather conditions for the overall system location.
The card provides information such as:
| Information | Description |
|---|---|
| Temperature | Current temperature. |
| Weather Condition | Current weather condition. |
| Humidity | Current humidity level. |
| AQI | Current Air Quality Index. |
This provides users with environmental information alongside the AMR system data.
¶ Critical Error Types
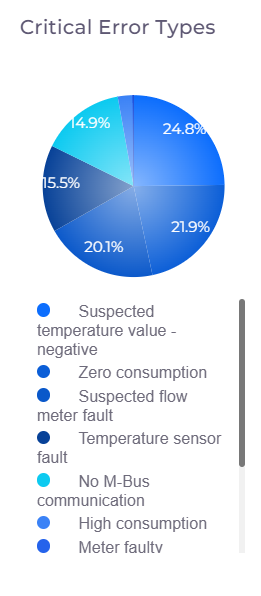
The Critical Error Types chart provides an organization-wide breakdown of critical error categories.
The chart displays both the percentage and number of affected devices for each critical error category.
Critical error categories can include:
- Suspected Temperature Value
- Zero Consumption
- Flow Meter Fault
- Temperature Sensor Fault
- No M-Bus Communication
This allows users to quickly identify the major categories of critical issues affecting devices across the organization.
Warning: Critical Error Types can help users identify error categories that may require immediate investigation or maintenance attention.
¶ Overview Dashboard Workflow
The Overview page can be used as a starting point for monitoring the AMR system.
Users can:
- Review the Emirate-wise Summary Cards.
- Check the Overall System Summary.
- Review Connected and Disconnected Sites.
- Check recent 30-day Consumption.
- Review Consumption Trends.
- Check the Meter Health Status.
- Use the Map to locate buildings and identify offline sites.
- Review the current Weather information.
- Check Critical Error Types for organization-wide issues.
- Select a building from the map to open its Facility Overview.
¶ Overall Purpose
The Overview page provides a consolidated view of the AMR system and serves as the primary dashboard for monitoring system status and performance.
It helps users:
- Monitor the distribution of sites and meters across Emirates.
- Check overall system totals.
- Identify connected and disconnected sites.
- Monitor meter health.
- Review recent building consumption.
- Analyze consumption trends.
- Locate buildings on the map.
- Identify offline buildings.
- Review current weather conditions.
- Identify critical error categories.
- Navigate to detailed building information.
Important: The Overview page is designed to provide a quick system-level view. Detailed investigation can be performed by navigating from the Overview page to the relevant building or dashboard.
¶ Quick Reference
| Section | Purpose |
|---|---|
| Emirate-wise Summary | View site and meter counts by Emirate. |
| Overall System Summary | View total Emirates, buildings, and meters. |
| Site Connectivity Status | View connected and disconnected sites. |
| Last 30 Days Consumption | View recent RTh and kWh consumption. |
| Consumption Trends | Review daily consumption and average consumption over 30 days. |
| Health Status | View meter health categories. |
| Map | Locate buildings and identify offline sites. |
| Weather | View current temperature, weather, humidity, and AQI. |
| Critical Error Types | View organization-wide critical error categories. |
| Facility Overview | Open detailed information for a selected building. |